Observability
(PHP 8.6+, true_async_server 0.10+)
The server can report request statistics, write structured logs, and emit one access-log record per request. Everything here is off by default.
Request statistics: getStats()
Turn statistics on with setStatsEnabled(true), then read them with getStats():
use TrueAsync\HttpServer;
use TrueAsync\HttpServerConfig;

$config = (new HttpServerConfig())
    ->addListener('0.0.0.0', 8080)
    ->setWorkers(4)
    ->setStatsEnabled(true);

$server = new HttpServer($config);
$server->addHttpHandler(fn ($req, $res) => $res->json(['ok' => true]));

$server->start();
getStats() returns per-worker counters and a combined total. It throws if statistics were not enabled.
[
    'enabled' => true,
    'workers' => [ 0 => [ /* one worker's counters */ ], 1 => [ … ] ],
    'totals'  => [ /* summed across workers */ ],
]
totals holds:
| Counter | Meaning |
|---|---|
total_requests | requests completed |
responses_2xx_total … responses_5xx_total | responses per status class; the four sum to total_requests |
conns_active_h1 / _h2 / _h3 | open connections per protocol |
Totals keep growing across a reload(); the connection counters track only live workers.
Prometheus and Grafana
The server does not expose a /metrics endpoint itself — getStats() hands you a plain PHP array, and you turn it into whatever your monitoring stack expects. For Prometheus that means one small handler that formats the array as the text exposition format:
use TrueAsync\HttpServer;
use TrueAsync\HttpServerConfig;

$config = (new HttpServerConfig())
    ->addListener('0.0.0.0', 8080)
    ->setWorkers(4)
    ->setStatsEnabled(true);

$server = new HttpServer($config);

$server->addHttpHandler(function ($req, $res) use ($server) {
    if ($req->getPath() === '/metrics') {
        $t = $server->getStats()['totals'];

        $body  = "# HELP http_requests_total Requests completed.\n";
        $body .= "# TYPE http_requests_total counter\n";
        $body .= "http_requests_total {$t['total_requests']}\n";

        $body .= "# HELP http_responses_total Responses by status class.\n";
        $body .= "# TYPE http_responses_total counter\n";
        foreach (['2xx', '3xx', '4xx', '5xx'] as $class) {
            $body .= "http_responses_total{class=\"{$class}\"} {$t["responses_{$class}_total"]}\n";
        }

        $body .= "# HELP http_connections_active Open connections by protocol.\n";
        $body .= "# TYPE http_connections_active gauge\n";
        foreach (['h1', 'h2', 'h3'] as $proto) {
            $body .= "http_connections_active{protocol=\"{$proto}\"} {$t["conns_active_{$proto}"]}\n";
        }

        $res->setHeader('Content-Type', 'text/plain; version=0.0.4')->end($body);
        return;
    }

    $res->json(['ok' => true]);
});

$server->start();
Point Prometheus at the endpoint:
scrape_configs:
  - job_name: 'true-async-server'
    static_configs:
      - targets: ['your-server:8080']
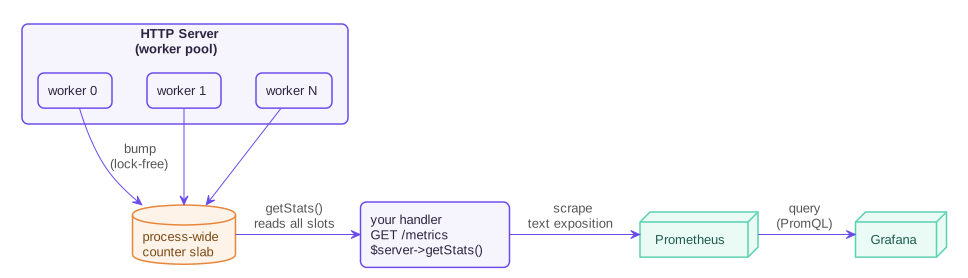
The counters live in one process-wide table that every worker updates and getStats() reads, so a single scrape covers the whole pool:
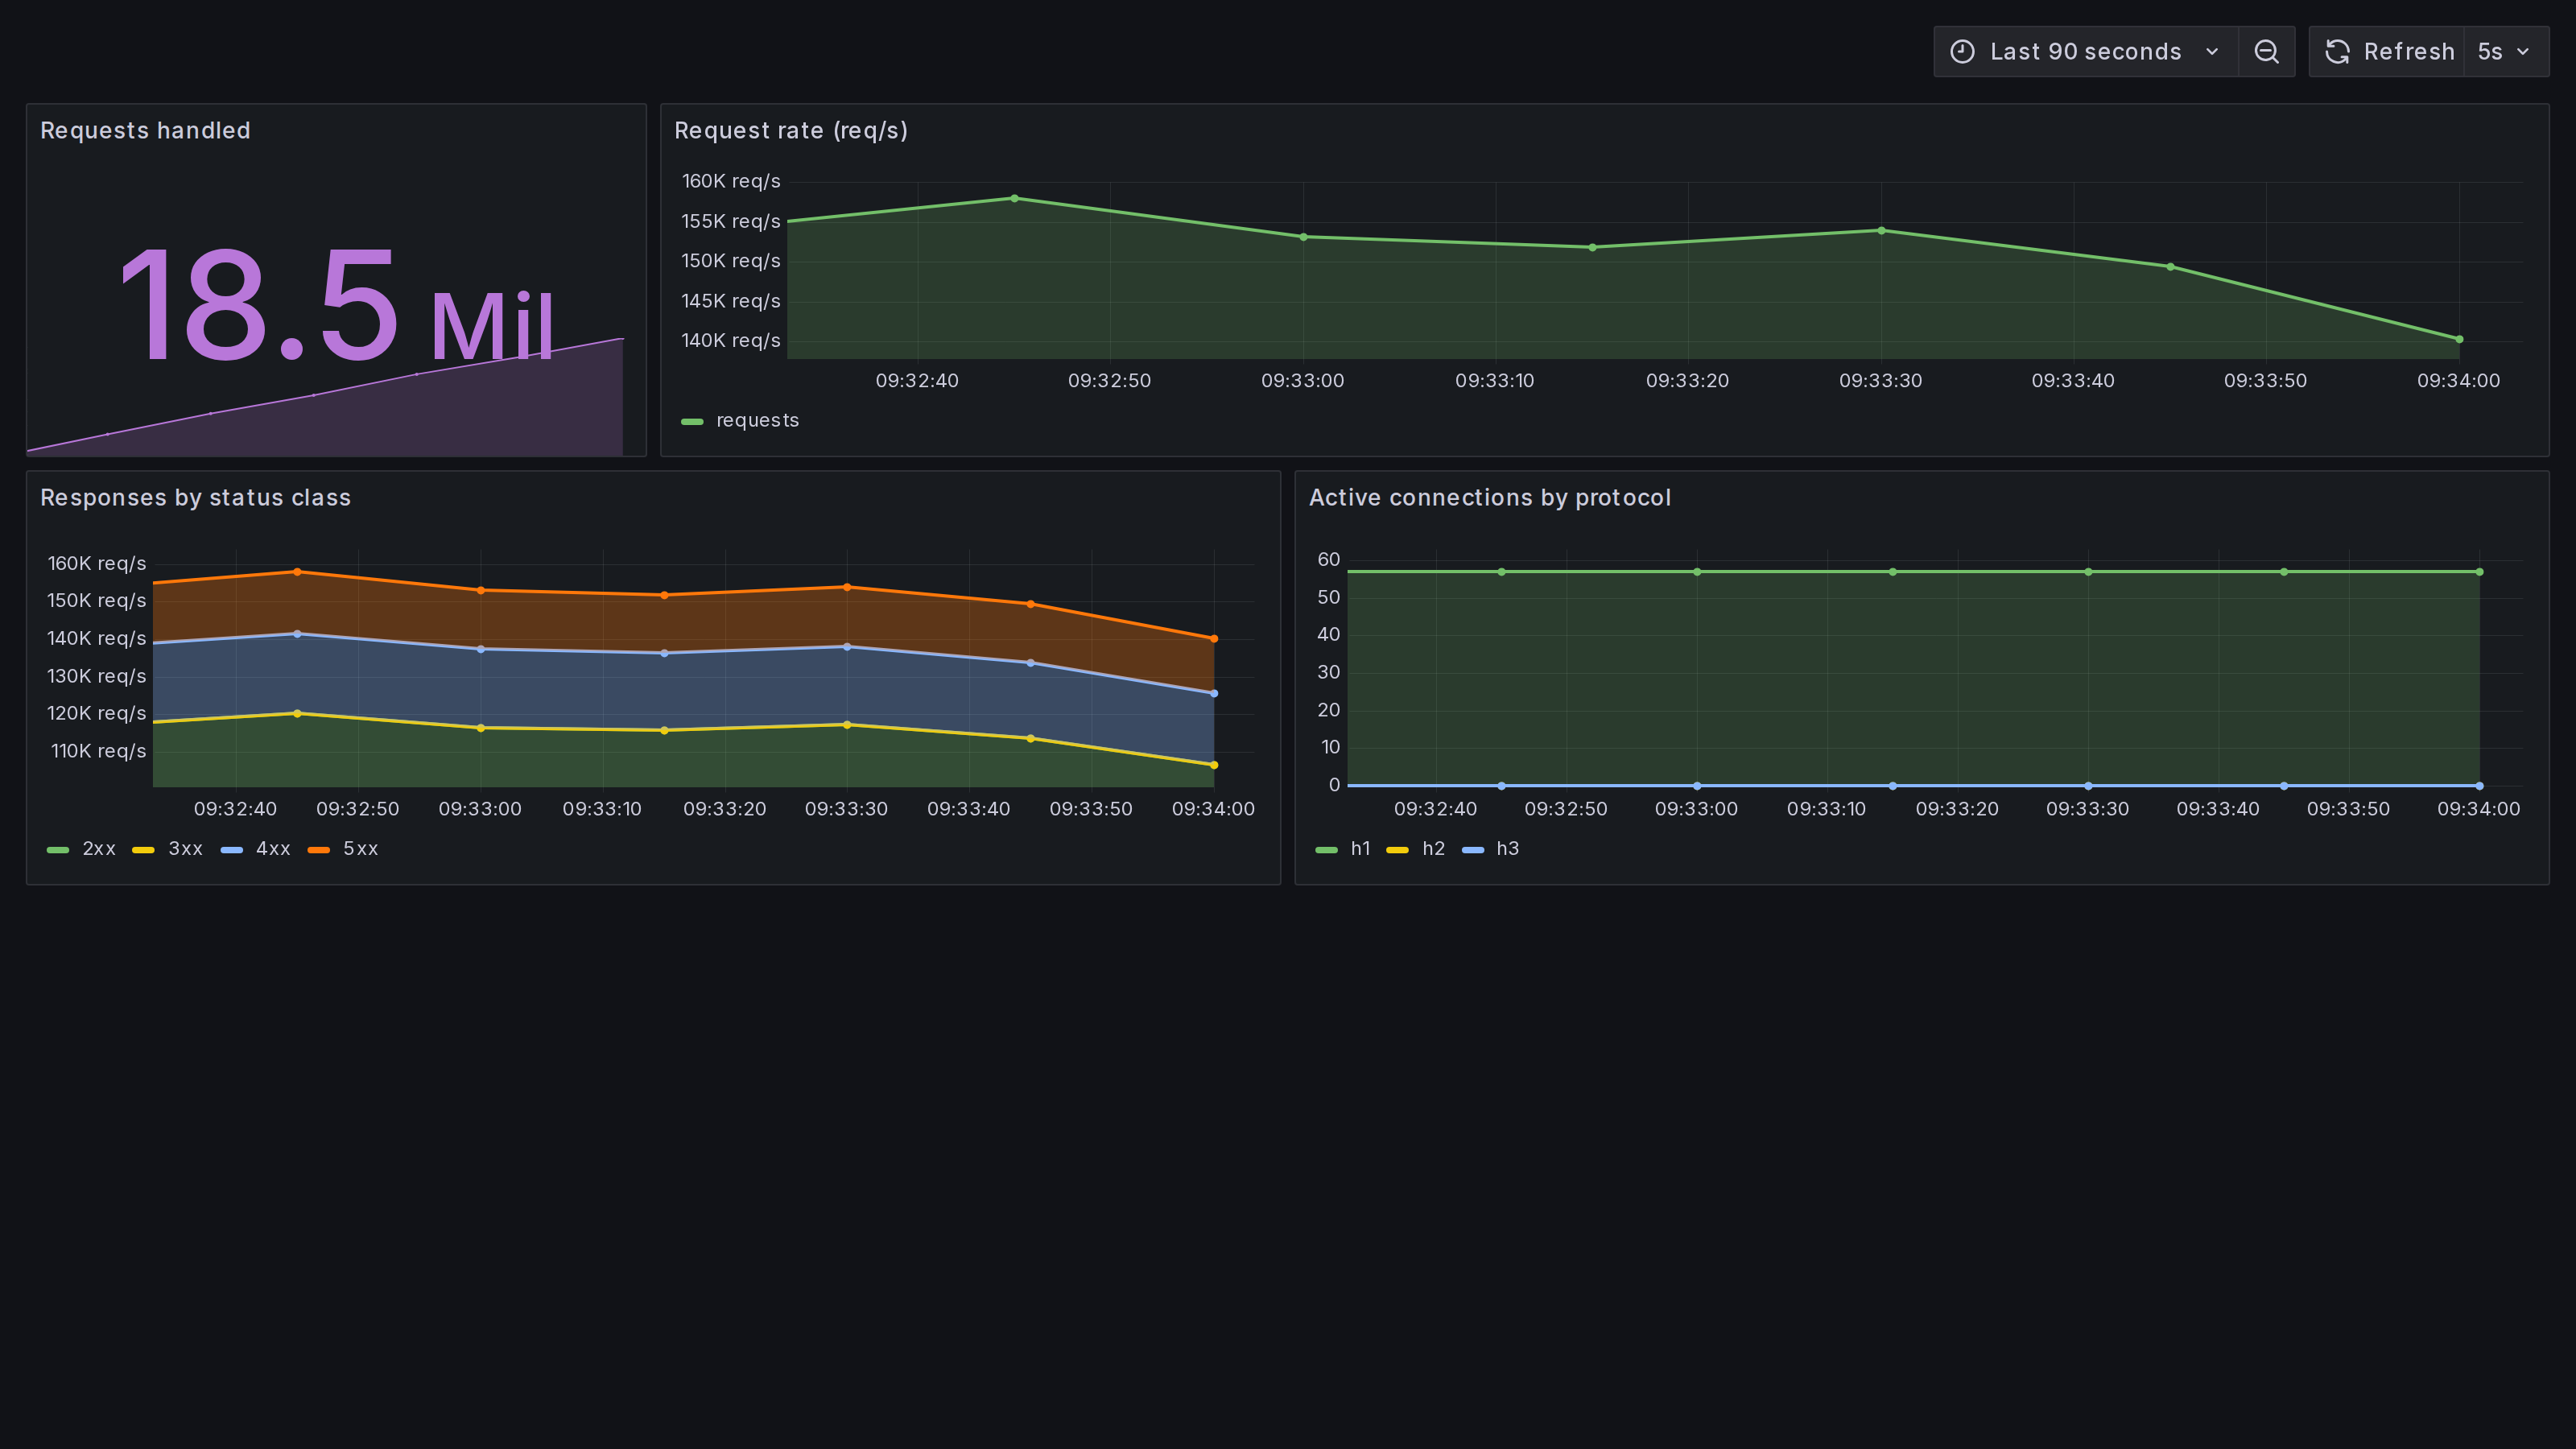
From there Grafana graphs the request rate, status classes and open connections like any other Prometheus source:
Logging: setLogSinks()
setLogSinks() sends each log record to one or more destinations, each with its own format and minimum level:
use TrueAsync\LogSeverity;

$config->setLogSinks([
    ['type' => 'file', 'path' => '/var/log/app/access.log',
     'format' => 'json', 'category' => 'access', 'level' => LogSeverity::INFO],

    ['type' => 'stderr', 'format' => 'pretty', 'level' => LogSeverity::WARN],
]);
Up to 8 destinations. This replaces the single-stream setLogSeverity() / setLogStream().
Where a record goes — type is file, stdout, stderr, syslog, or stream. With a worker pool, use file (or stdout / stderr): a stream resource opened by the parent cannot be shared with worker threads, so it is used only on the parent.
How it looks — format is plain, logfmt, json, pretty (a coloured console line), or template:
['type' => 'stdout', 'format' => 'template',
 'template' => '{ts:Y-m-d H:i:s.v} [{level}] {msg}{attrs}', 'level' => LogSeverity::INFO]
Placeholders: {ts} or {ts:PATTERN} (date()-style Y y m d H i s v), {level}, {msg}, {attrs}, {trace}, {span}. Anything else is printed as written.
A syslog destination speaks RFC 5424 over TCP, UDP, or a unix socket:
['type' => 'syslog', 'target' => 'udg:///dev/log',
 'facility' => 'local0', 'level' => LogSeverity::INFO]
Access log
Set category to choose what a destination receives: app (the default) gets server diagnostics, access gets one record per completed request, all gets both. So a JSON access log and a readable diagnostics console can run side by side.
Access records follow the OpenTelemetry HTTP conventions. One json record:
{
    "Timestamp": "2026-07-15T07:03:37.740Z",
    "SeverityText": "INFO",
    "Body": "GET /x 200",
    "Attributes": {
        "http.request.method": "GET",
        "url.path": "/x",
        "http.response.status_code": 200,
        "network.protocol.version": "1.1",
        "http.response.body.size": 11,
        "http.server.request.duration": 9.266e-06,
        "client.address": "127.0.0.1",
        "client.port": 42336
    }
}
A record is written for every request over HTTP/1, HTTP/2 and HTTP/3, including under a worker pool. If the request carried a W3C trace context, it is included.
Runtime counters: getRuntimeStats()
getRuntimeStats() reports the server's own memory pools and cross-worker WebSocket topic traffic — useful for attributing memory growth to a subsystem. No opt-in needed. Keys include the connection arena (conn_arena_*), the request-body pool (body_pool*), and topic delivery (ws_topic_posted / ws_topic_skipped / ws_topic_dropped).
HTTP/3 counters: getHttp3Stats()
getHttp3Stats() returns one entry per HTTP/3 listener with its QUIC counters (quic_packets_sent, quic_bytes_sent, datagram counts, and so on). It returns an empty array on a build without --enable-http3.
See also
- Multi-worker: logging and shutdown under a pool
- Configuration
HttpServer::getStats()