Osservabilità
(PHP 8.6+, true_async_server 0.10+)
Il server può riportare le statistiche delle richieste, scrivere log strutturati ed emettere un record di access log per ogni richiesta. Tutto ciò che segue è disattivato di default.
Statistiche delle richieste: getStats()
Attiva le statistiche con setStatsEnabled(true), poi leggile con getStats():
use TrueAsync\HttpServer;
use TrueAsync\HttpServerConfig;

$config = (new HttpServerConfig())
    ->addListener('0.0.0.0', 8080)
    ->setWorkers(4)
    ->setStatsEnabled(true);

$server = new HttpServer($config);
$server->addHttpHandler(fn ($req, $res) => $res->json(['ok' => true]));

$server->start();
getStats() restituisce i contatori per worker più un totale combinato. Lancia un'eccezione se le statistiche non sono state abilitate.
[
    'enabled' => true,
    'workers' => [ 0 => [ /* one worker's counters */ ], 1 => [ … ] ],
    'totals'  => [ /* summed across workers */ ],
]
totals contiene:
| Contatore | Significato |
|---|---|
total_requests | richieste completate |
responses_2xx_total … responses_5xx_total | risposte per classe di stato; le quattro sommano a total_requests |
conns_active_h1 / _h2 / _h3 | connessioni aperte per protocollo |
I totali continuano a crescere attraverso un reload(); i contatori di connessione seguono solo i worker vivi.
Prometheus e Grafana
Il server non espone da sé un endpoint /metrics — getStats() ti consegna un semplice array PHP, e tu lo trasformi in ciò che il tuo stack di monitoraggio si aspetta. Per Prometheus questo significa un piccolo handler che formatta l'array nel text exposition format:
use TrueAsync\HttpServer;
use TrueAsync\HttpServerConfig;

$config = (new HttpServerConfig())
    ->addListener('0.0.0.0', 8080)
    ->setWorkers(4)
    ->setStatsEnabled(true);

$server = new HttpServer($config);

$server->addHttpHandler(function ($req, $res) use ($server) {
    if ($req->getPath() === '/metrics') {
        $t = $server->getStats()['totals'];

        $body  = "# HELP http_requests_total Requests completed.\n";
        $body .= "# TYPE http_requests_total counter\n";
        $body .= "http_requests_total {$t['total_requests']}\n";

        $body .= "# HELP http_responses_total Responses by status class.\n";
        $body .= "# TYPE http_responses_total counter\n";
        foreach (['2xx', '3xx', '4xx', '5xx'] as $class) {
            $body .= "http_responses_total{class=\"{$class}\"} {$t["responses_{$class}_total"]}\n";
        }

        $body .= "# HELP http_connections_active Open connections by protocol.\n";
        $body .= "# TYPE http_connections_active gauge\n";
        foreach (['h1', 'h2', 'h3'] as $proto) {
            $body .= "http_connections_active{protocol=\"{$proto}\"} {$t["conns_active_{$proto}"]}\n";
        }

        $res->setHeader('Content-Type', 'text/plain; version=0.0.4')->end($body);
        return;
    }

    $res->json(['ok' => true]);
});

$server->start();
Punta Prometheus all'endpoint:
scrape_configs:
  - job_name: 'true-async-server'
    static_configs:
      - targets: ['your-server:8080']
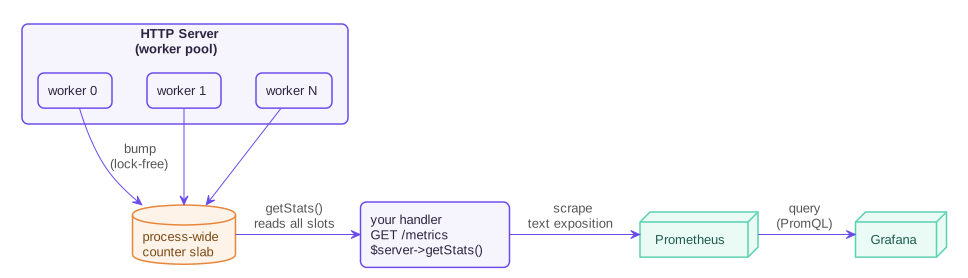
I contatori vivono in un'unica tabella a livello di processo che ogni worker aggiorna e che getStats() legge, così un singolo scrape copre l'intero pool:
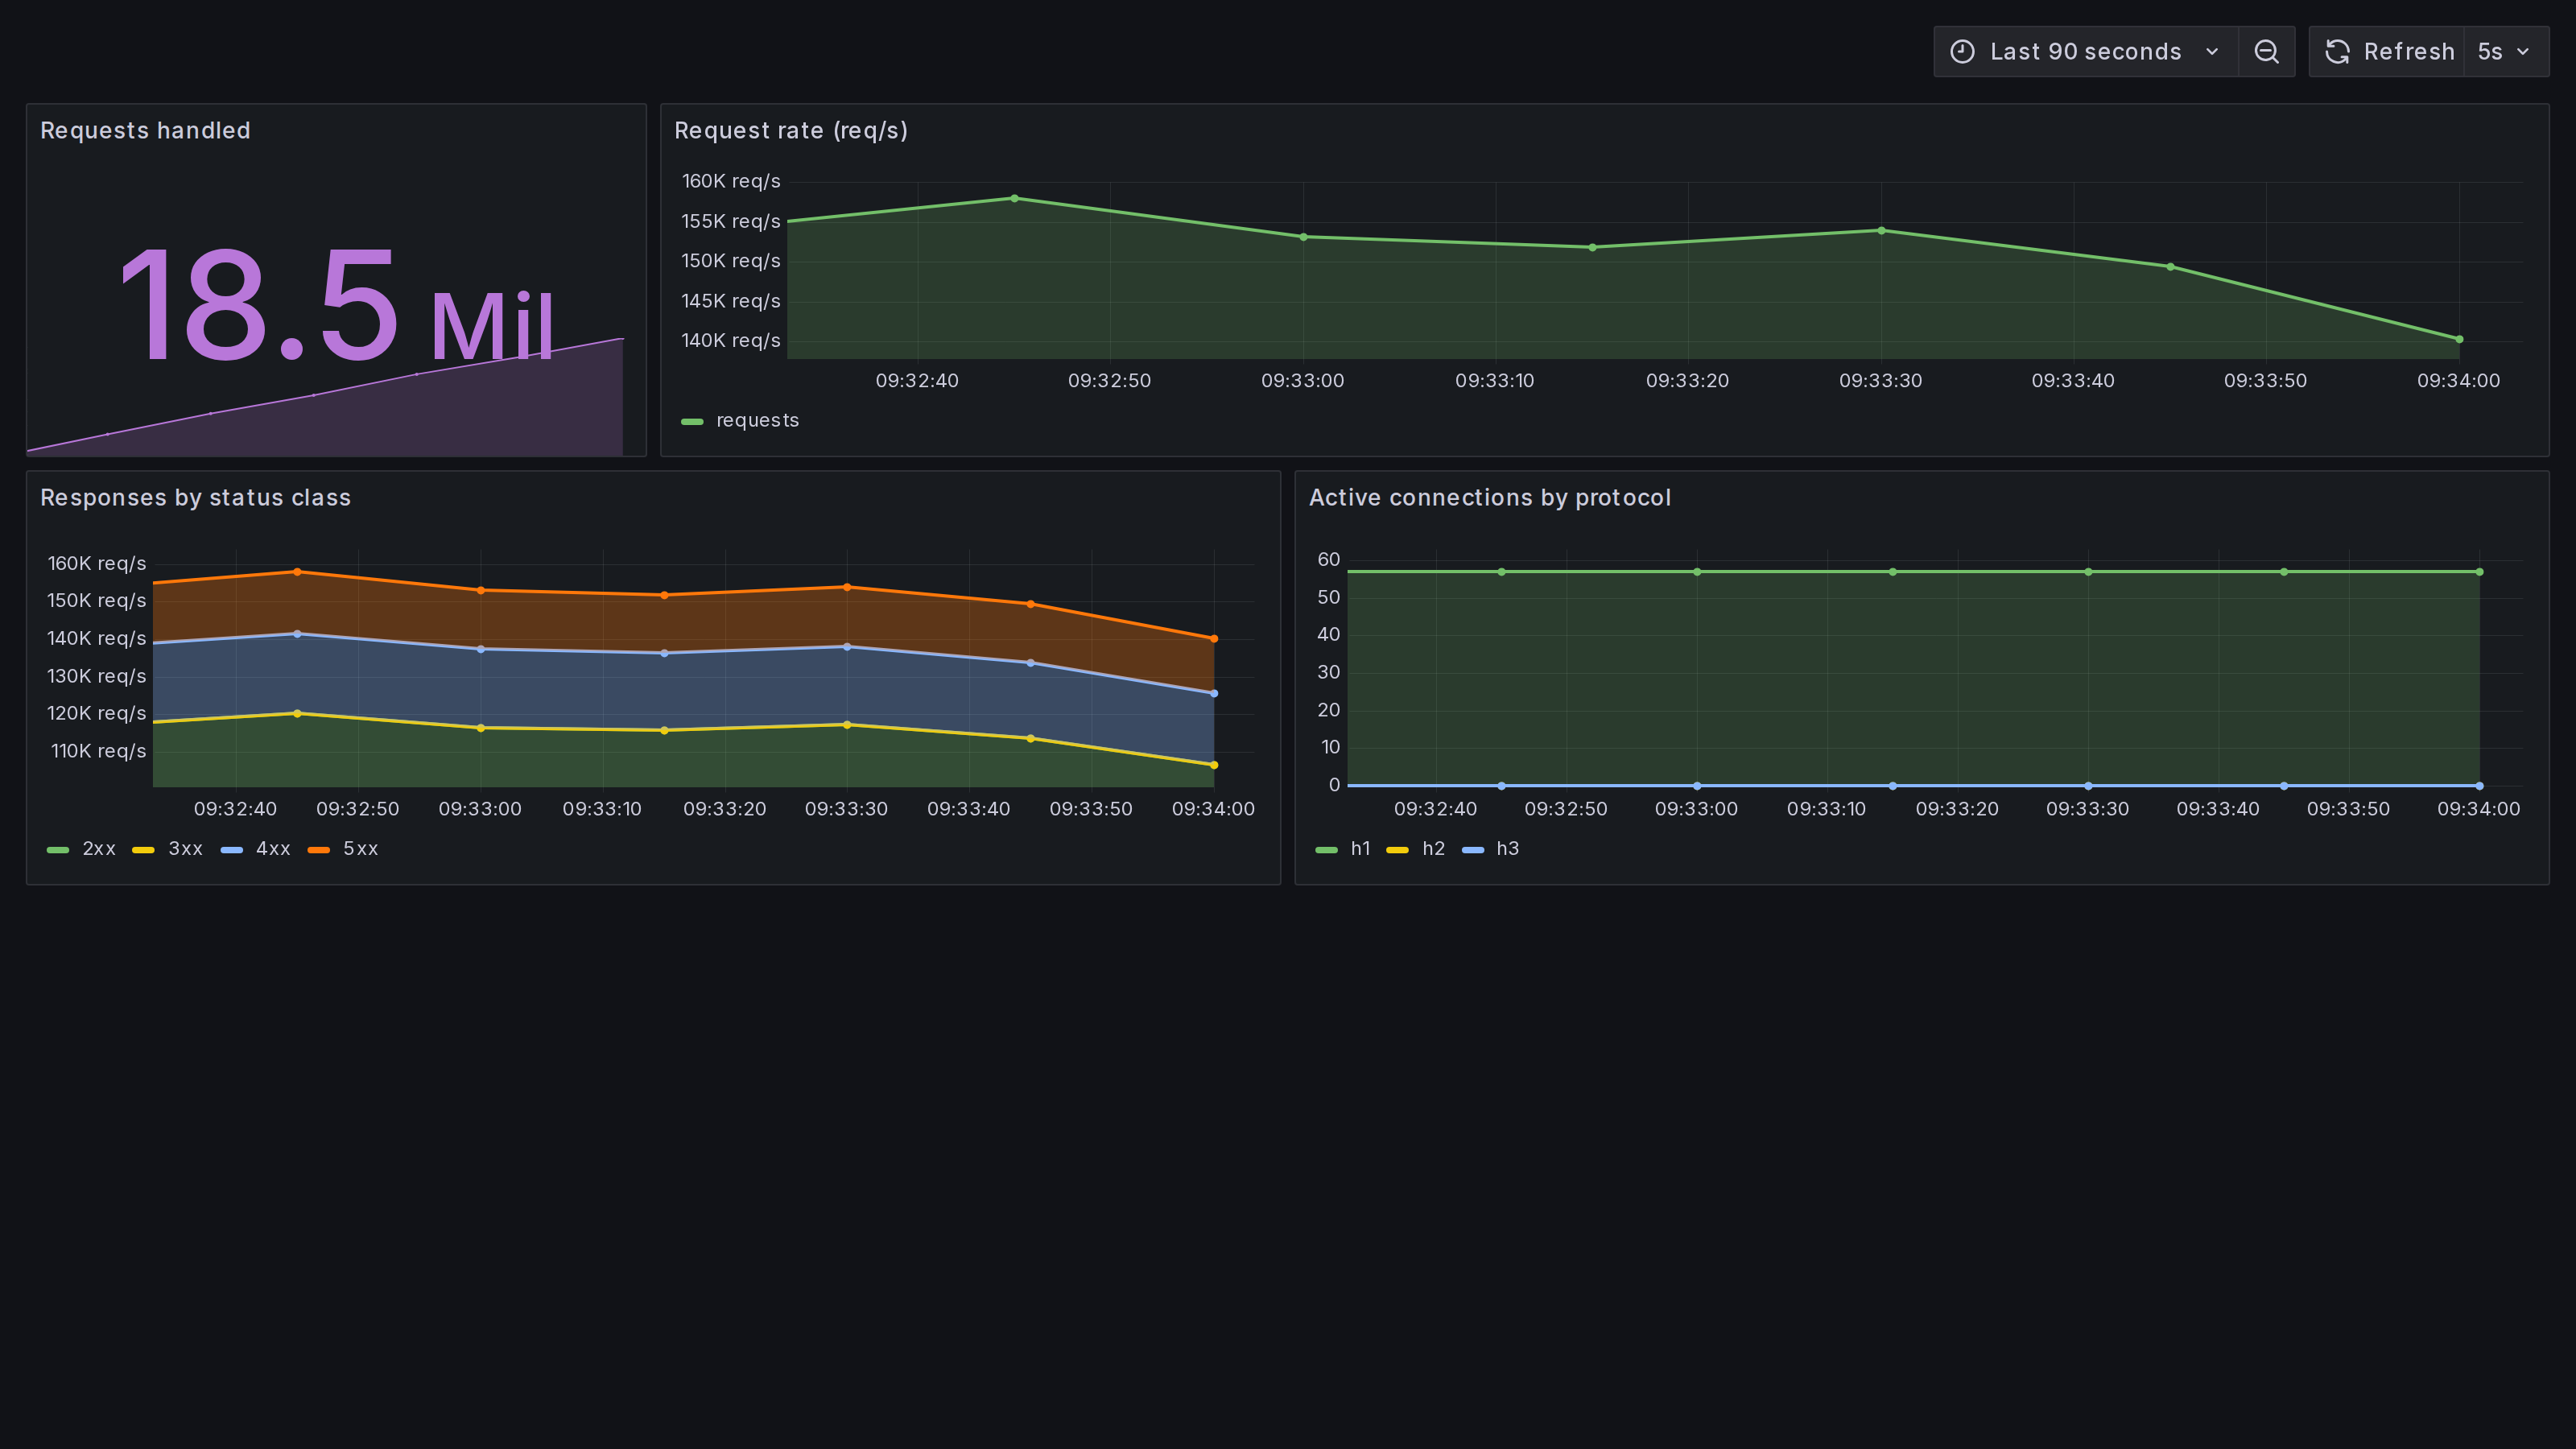
Da lì Grafana traccia il tasso delle richieste, le classi di stato e le connessioni aperte come qualunque altra sorgente Prometheus:
Logging: setLogSinks()
setLogSinks() invia ogni record di log a una o più destinazioni, ciascuna con il proprio formato e il proprio livello minimo:
use TrueAsync\LogSeverity;

$config->setLogSinks([
    ['type' => 'file', 'path' => '/var/log/app/access.log',
     'format' => 'json', 'category' => 'access', 'level' => LogSeverity::INFO],

    ['type' => 'stderr', 'format' => 'pretty', 'level' => LogSeverity::WARN],
]);
Fino a 8 destinazioni. Questo sostituisce lo setLogSeverity() / setLogStream() a singolo stream.
Dove va un record — type è file, stdout, stderr, syslog o stream. Con un pool di worker usa file (o stdout / stderr): una risorsa stream aperta dal padre non può essere condivisa con i thread worker, quindi viene usata solo sul padre.
Come appare — format è plain, logfmt, json, pretty (una riga di console colorata) o template:
['type' => 'stdout', 'format' => 'template',
 'template' => '{ts:Y-m-d H:i:s.v} [{level}] {msg}{attrs}', 'level' => LogSeverity::INFO]
Segnaposto: {ts} o {ts:PATTERN} (in stile date(), Y y m d H i s v), {level}, {msg}, {attrs}, {trace}, {span}. Tutto il resto è stampato così com'è.
Una destinazione syslog parla RFC 5424 su TCP, UDP o un socket unix:
['type' => 'syslog', 'target' => 'udg:///dev/log',
 'facility' => 'local0', 'level' => LogSeverity::INFO]
Access log
Imposta category per scegliere cosa riceve una destinazione: app (il default) riceve la diagnostica del server, access riceve un record per ogni richiesta completata, all riceve entrambi. Così un access log JSON e una console di diagnostica leggibile possono coesistere.
I record di accesso seguono le convenzioni HTTP di OpenTelemetry. Un record json:
{
    "Timestamp": "2026-07-15T07:03:37.740Z",
    "SeverityText": "INFO",
    "Body": "GET /x 200",
    "Attributes": {
        "http.request.method": "GET",
        "url.path": "/x",
        "http.response.status_code": 200,
        "network.protocol.version": "1.1",
        "http.response.body.size": 11,
        "http.server.request.duration": 9.266e-06,
        "client.address": "127.0.0.1",
        "client.port": 42336
    }
}
Un record viene scritto per ogni richiesta su HTTP/1, HTTP/2 e HTTP/3, incluso sotto un pool di worker. Se la richiesta portava un trace context W3C, viene incluso.
Contatori a runtime: getRuntimeStats()
getRuntimeStats() riporta i pool di memoria del server stesso e il traffico dei topic WebSocket cross-worker — utile per attribuire la crescita della memoria a un sottosistema. Non serve opt-in. Le chiavi includono l'arena delle connessioni (conn_arena_*), il pool dei corpi di richiesta (body_pool*) e la consegna dei topic (ws_topic_posted / ws_topic_skipped / ws_topic_dropped).
Contatori HTTP/3: getHttp3Stats()
getHttp3Stats() restituisce una voce per ogni listener HTTP/3 con i suoi contatori QUIC (quic_packets_sent, quic_bytes_sent, conteggi di datagrammi, e così via). Restituisce un array vuoto su una build senza --enable-http3.
Vedi anche
- Multi-worker: logging e shutdown sotto un pool
- Configurazione
HttpServer::getStats()